December and 2015 Summary – Hot and Historic

Warm and Wet El Niño December caps a Historic, Fiery and Dry 2015.
The banner image on this post is courtesy Russ and Brenda Widdess. It shows Mt. Kiltsa earlier this year. The mountain’s name (“Kleet-sah”) means “Always White” in the Nuu-cha-nulth languages. This year, perhaps for the first time in both the modern and thousands of years of verbal first nations history, Mt. Klitsa was not white. It actually was completely devoid of snow on its face by October when I took this picture in the opposite direction from the top with my Mom.
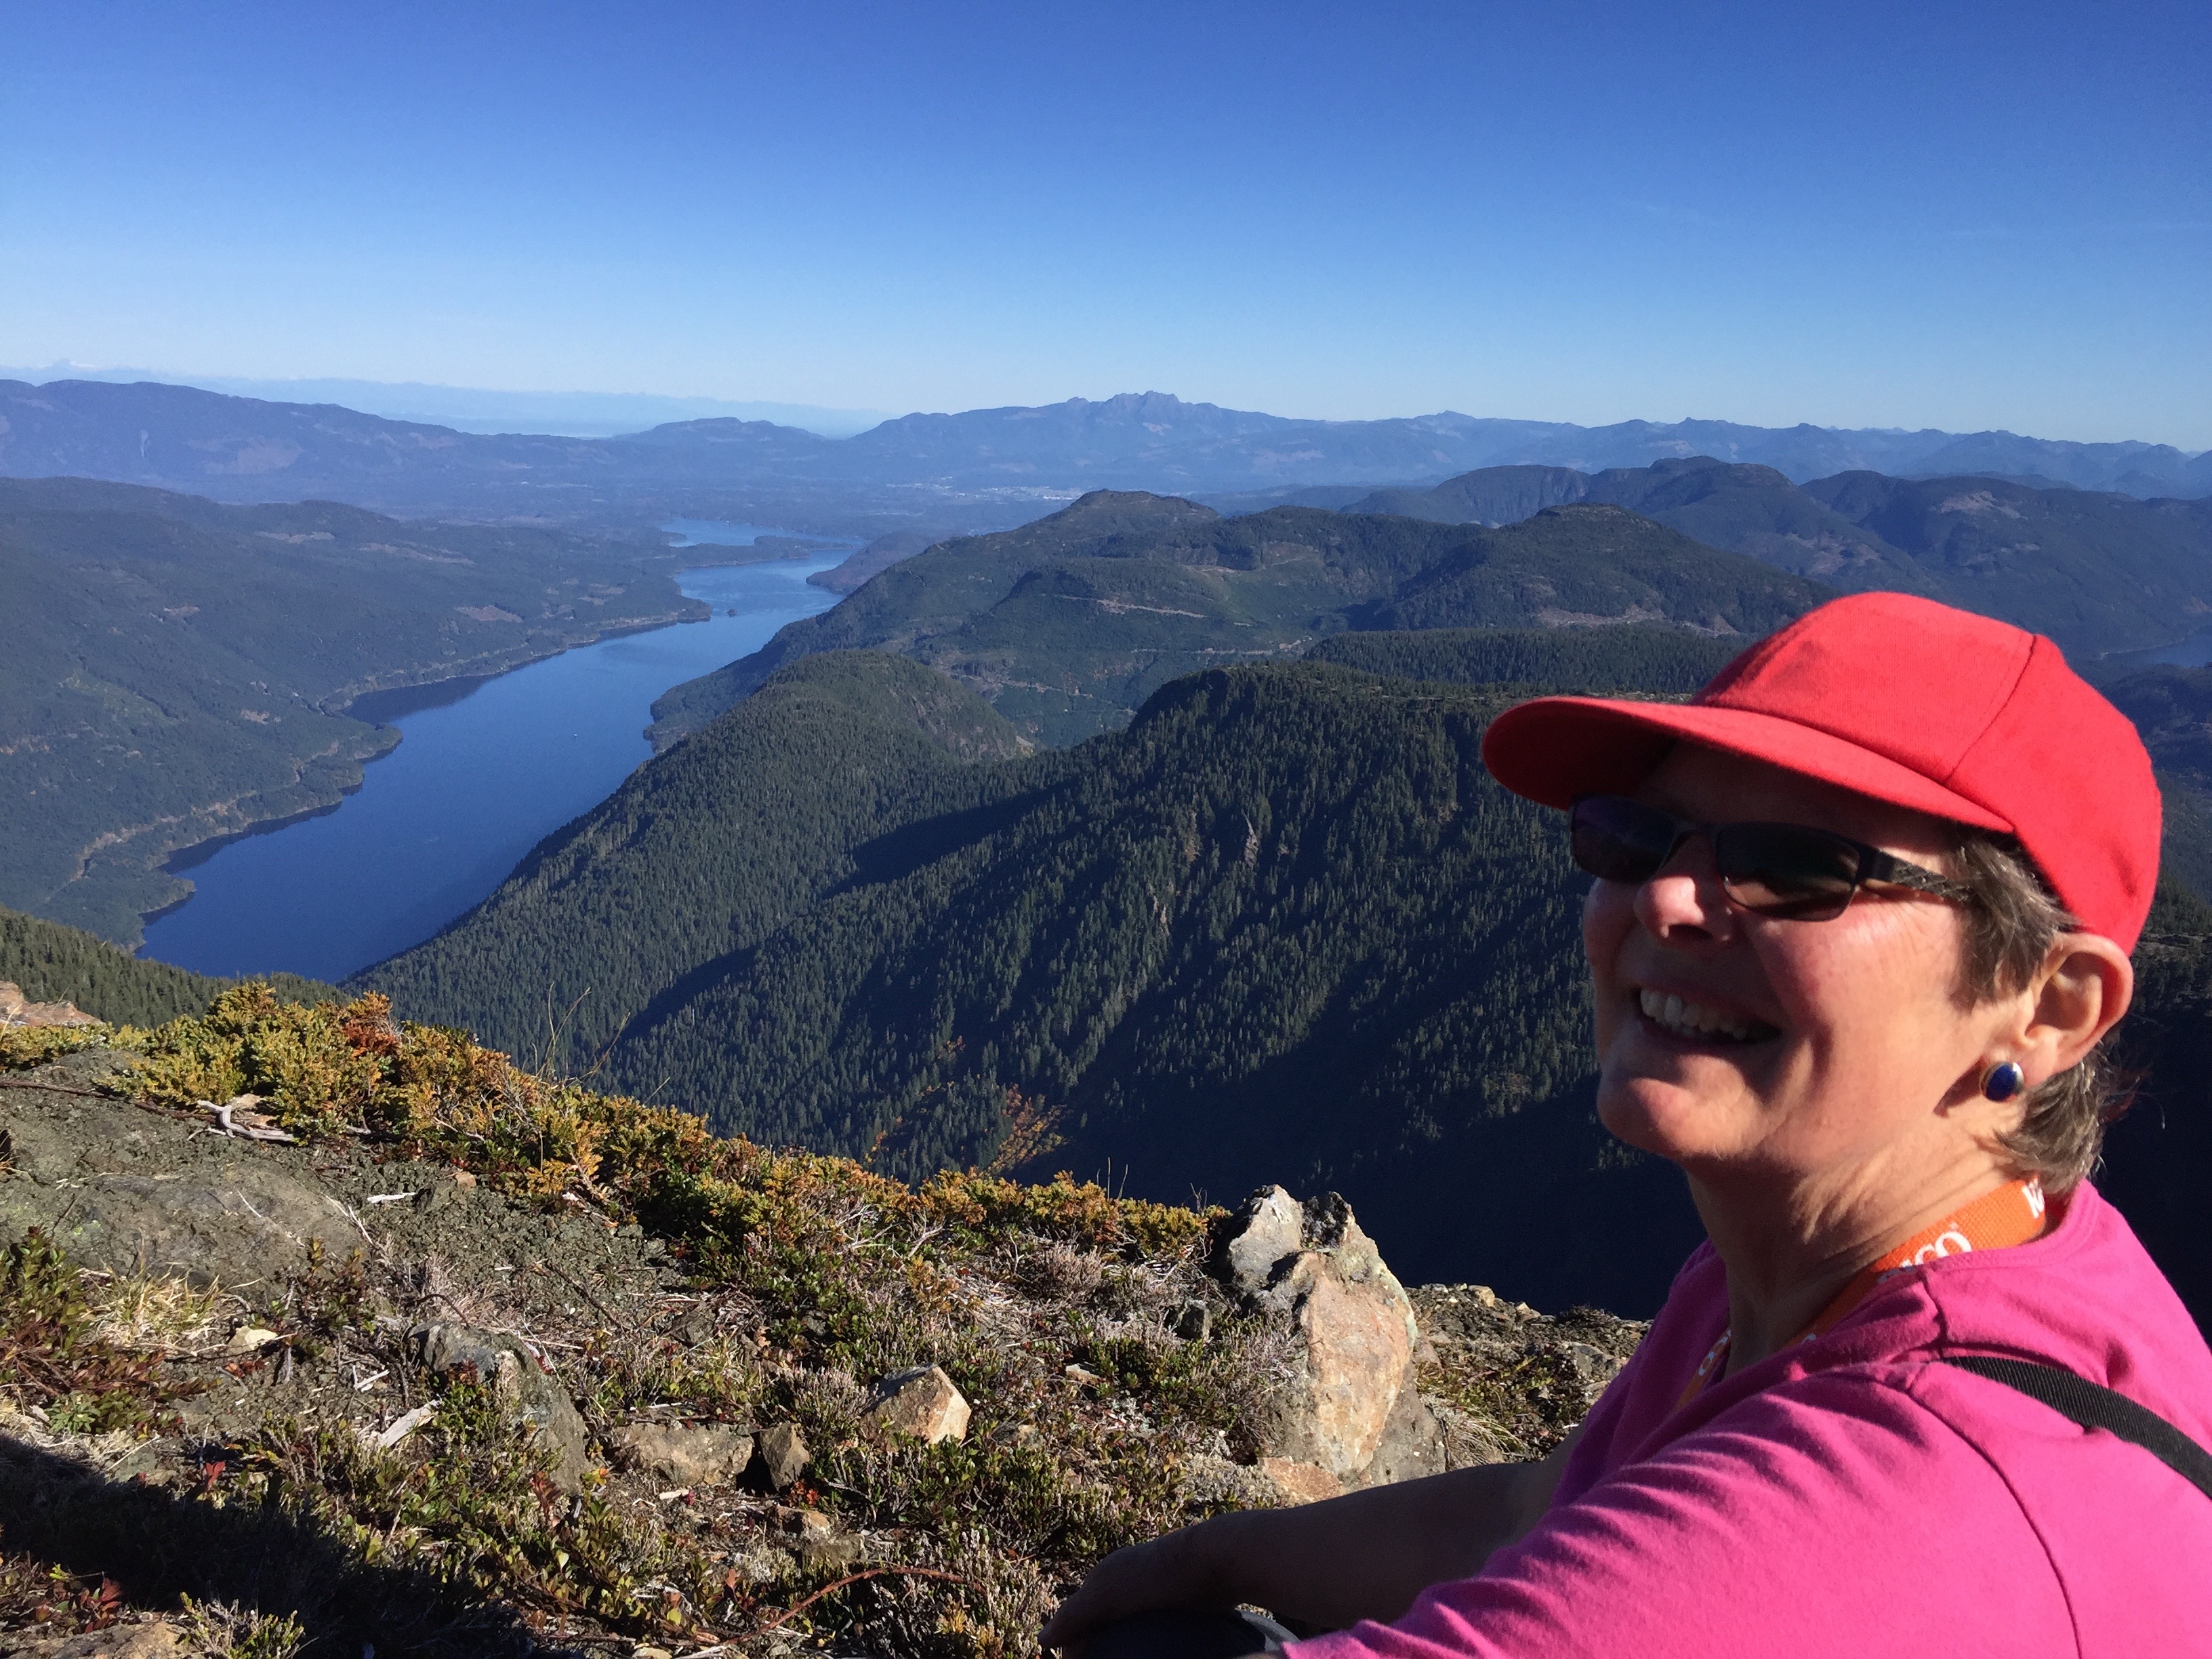
You can also see a bare Mt. Arrowsmith in the background. An indication of the record low snowpack all over the Island. You can see last year’s snowpack in green in the graph below courtesy the BC River Forecast Centre and this year’s in dark blue.

Thankfully, our current snowpack was 91% of normal as of January 1st. We can likely thank the dissipation of “the Blob” and some vigorous December rain and snow events for the snowpack. In fact the airport set 3 new daily rain records (and 2 high temp records) early in December including one that missed the all time high by just 6mm.
That late arrival of a rejuvenated snowpack did not stop us from, for the second year in a row, setting multiple record highs and pushing the overall annual average temperatures to new heights.
The Official station at Port Alberni Airport set a new modern record average temperature since 1961 of 10.97ºC median daily temperature for the year.
This beat the last major El Niño year of 1998 as well as last year.
City Station minimum average record since 1900s blown away.
Unofficially, the various island weather.ca stations including this one combined to blow away the previous all time, all station (Valley or City), minimum average temperature of 6.4ºC with a new record of 7.4ºC. They only missed sweeping the median and high averages by a few tenths of a degree. You can see all the records at the bottom of this post.
46 new high records set at Airport.
In case you’re wondering if warming has ‘stopped’ since the 1990s… the official Port Alberni Airport station, which was activated in 1995, set over 1 month worth of new record daily temperatures at the station including 4 all time highs for all stations since 1900. It also set 17 rain records (1 all time) and 8 lows (no all time).
Local fires made presence felt.
I would be remiss not to mention the catastrophic fire situation we experienced all over B.C. but also including in the Alberni Valley. The province just missed another record high in hectares burned. The Dog Mountain fire likely is still smouldering under the ground on the hillsides and few will forget the incredible smoke of those July days from both Dog Mountain and the massive fires in the Interior.
BCwildfire.ca has a summary for 2015.
In 2015 there were 1,835 wildfires, 304,484 hectares burned and $282 million spent. From their report:
British Columbia endured a major wildfire season in 2015 that saw aggressive fire activity, an above-average number of wildfires and hectares burned, and significant impacts on people and communities throughout the province. While lightning accounted for over two thirds (or 1,234) of wildfires in 2015, many of the most destructive fires were caused by people, and therefore preventable.
Given the sustained level of activity across B.C., additional personnel and resources were imported from other Canadian jurisdictions as well as Australia, South Africa and the United States. A total of 310 out-of-province personnel were brought in to assist. At the height of the season, approximately 2,500 personnel were working both on the fireline and in support positions across the province.
It is my hope that in 2015 the BC Government puts the Hawaii Mars back on standby from the first day so that it can help as much as possible this year. There is no telling how bad this year will be. BUt 2014 and 2015 were definitely a step above previous years.

Rain records at Official Station Irrelevant
Once again, December barely registered any measurements at all for rainfall at the Airport station. This station has now become basically useless for measuring rainfall. It also has 12 Days completely missing from the official record for all values. This is not a large enough error to throw off the temperatures but it is not a good sign.
The most reliable stations in Port Alberni right now unfortunately are the islandweather.ca stations including this one.
Despite wet December a dry 2015
Even though we got more than a normal amount of rain for the month of December that was not enough to bring us past 75% of normal for the whole year. The first half of the year was exceptionally dry. We are lucky the rains came back.
Check out the El Niño forecast, the outlooks, and the stats below.
El Niño – Will update when this month’s update is released by the NOAA later this week but look at the global forecasts below for a hint.
Outlooks — Stable with periodic precipitation. Little chance of ‘white’.
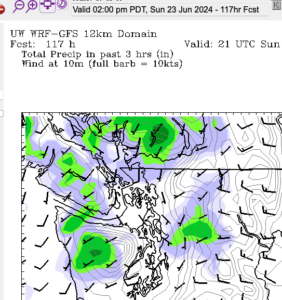
Here are the 16-day GEPS consensus graphs from SpotX for the rest of January. There do not appear to any serious dips below zero and looks like the rain will gradually build through the month starting today.


Three-Month Forecasts
Below is the February, March, April period. The heat in Canada, especially northern Canada remains crazy. Again, these models are consistent, persistent, and are proving true. Thankfully, the insanely high anomalies have backed off a little bit but remain incredibly high north of 60.

Here is last month’s picture for the previous three month period.

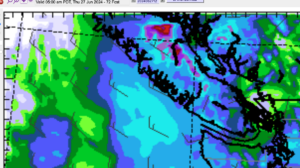
Here is the Precipitation Forecast. The models are sticking to a near normal or slightly below normal forecast for precipitation

Last month’s forecast for the previous 3 month period.

Here are Sea Surface Temperature anomalies. The Pacific heat near North America is slated to weaken a little more so “The Blob” is not nearly as prominent though it’s still quite warm off our coast. The El Niño area along the equator is weakening slightly.

Last month’s picture for the previous 3 month period

Seasonal Forecasts
Here are this months and last month’s forecast for global temperature and precipitation for Spring, Summer, Fall and/or Winter. Only one or two complete seasons are visible every month. This month we see the forecast for Spring and Summer.
The picture looks hotter for Spring for North America with large heat anomalies extending further east and south into the US.


The Summer forecast looks much less extreme for the entire Northern Hemisphere which is good news from a fire perspective and may be indicative of the models seeing a big weakening in El Niño.

The precipitation forecasts are much less dramatic with North America bathed in normalcy for the spring and summer forecasts. Again, I would suspect this is due to the weakening El Niño as you will see below.


Notice the summer forecast backs off on the extremes both in the dry and wet zones.

Sea Surface Temperatures stage a dramatic switch from the spring to summer forecast. In Spring you can see the averages are high, but not nearly as high they have been. But in the final image you’ll see the El Niño area going ‘blue’ which indicates a full reversal possibly into a La Niña phase. We will have to see if the official ENSO/El Niño forecast jives with this. This is a pretty dramatic shift not only in the El Niño area, but also a further cooling of waters off our coast so we will have to see if the models are correct this far out. This could be good news for our salmon stocks that took a hard hit last year.


That’s it for the wordy bits! Video, records and averages for both Demcember and the year are below!
Monthly Timelapse Video
Pssst: Switch it to HD. 🙂
(Head to the Alberniweather Youtube Channel to see all of the videos throughout the year and search for any day you want!)
Daily records set this month at the Airport (and compared to other stations* for “All Time”)
Two new Airport high temp records, three new Airport rain records, no low temp records, no all time records.
- **Rain Dec 2: 27.2 mm : #1 is 65.0 mm in 1946 at Port Alberni.
- Rain Dec 5: 75.6 mm : #1 is 81.3 mm in 1946 at Robertson Creek.
- Rain Dec 6: 38.6 mm : #1 is 65.0 mm in 1899 at Beaver Creek.
- High Temp Dec 6: 11.2º C: #1 is 14.4º C in 1925 at Beaver Creek.
- High Temp Dec 7: 10.0º C: #1 is 13.3º C in 1938/39 at Beaver Creek.
*Short Term (since 1995) Airport Records are compared to the 30+ year weather stations of record since 1900 at Beaver Creek, Port Alberni City and Robertson Creek.
**Measured at Alberniweather due to Missing Data at Official Environment Canada station
Daily and All time records set in 2015 at the Airport (and compared to other stations* for “All Time”)
See Monthly Summaries to see specific temperatures.
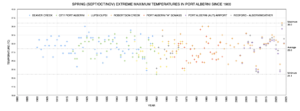
- 46 new high temperatures including 4 All Time (January 24, 25, 27 and June 27).
- 17 new rain records including one all time (August 8).
- 8 new low temperatures.
All Time High Averages.
Minimum, Overall and High
Historic and Modern Stations.
‘ DENOTES HIGHEST OUTER VALLEY RECORD
~DENOTES HIGHEST CITY/SEA LEVEL RECORD
^DENOTES HIGHEST IN MODERN RECORD
* DENOTES HIGHEST EVER RECORDED
Beaver Creek (1900-1959):
5.4º C (1934), 10.8° C (1926), 17.1º C (1925)*’
Port Alberni City (1917-1960):
6.4º C (1934), 11.7º C (1934)*~, 17.0° C (1934)
Robertson Creek (1961-2014):
5.8º C (1998)’, 10.7º C (1998), 15.6° C (1998)
Port Alberni “A” Somass (1969-1995):
5.6º C (1992), 10.6º C (1992), 15.8° C (1987)
Port Alberni Airport (1995-Now):
5.5º C (2015), 11.0º C (2015)’, 16.5° C (2015)
Overall City Averages – All islandweather.ca stations (2007-Now):
7.4º C (2015)^*~, 11.4º C (2015)^, 16.6° C (2015)^
December 2015 Minimum, Overall and High
Daily Average Temps See last month’s and last December’s summary.
Alberniweather: 1.7º C, 3.3° C, 5.6º C
Alberni Elementary School : 1.6º C, 3.3º C, 5.7° C
Maquinna Elementary School: 1.4º C, 2.9º C, 5.1° C
Neptune Canada Station: 1.9º C, 3.5º C, 5.7° C
Overall City Average: 1.7º C, 3.3 C, 5.5º C
Environment Canada Airport: 0.4º C, 2.6° C, 4.7º C
1981-2010 EC Normal (Robertson Creek): -0.3º C, 1.8º C, 3.8° C
Year of 2015 Minimum, Overall and High Daily Average Temps
See last Year’s summary.
Alberniweather: 7.5º C, 11.6° C, 16.7º C
Alberni Elementary School : 7.2º C, 11.5º C, 16.6° C
Maquinna Elementary School: 7.3º C, 11.2º C, 16.3° C
Neptune Canada Station: 7.7º C, 11.5º C, 16.8° C
Overall City Average: 7.4º C, 11.4 C, 16.6º C
Environment Canada Airport: 5.5º C, 11.0° C, 16.5º C
1981-2010 EC Normal (Robertson Creek): 4.5º C, 9.6º C, 14.6° C
Precipitation for December 2015:
Alberniweather: 393.7 mm
AES: 409.8 mm
MAQ: 480.4 mm
NEP: NA (not measured)
Overall City Average: 428.0 mm
EC: (Not Relevant 20 Days Missing Data!)
1981-2010 Env Canada Normal (Robertson Creek): 344.6 mm
Precipitation for Year of 2015:
Alberniweather: 1484.9 mm
AES: 1559.4 mm
MAQ: 1734.8 mm
NEP: NA (not measured)
Overall City Average: 1593.0 mm
EC: (Not Relevant over 200 Days Missing Data!)
1981-2010 Env Canada Normal (Robertson Creek): 2153.6 mm
Differences from Normal
December 2015
City Stations Temperature Difference from normal:
+2.3° C, +1.5º C, +1.7º C
Official (Airport) Temperature Difference from normal:
+0.7º C, +0.8º C, +0.9º C
City Stations Precipitation difference normal:
+83.4mm (124.2% of normal)
Official (Airport) Precipitation difference from normal:
NA
Year of 2015:
City Stations Temperature Difference from normal:
+2.3° C, +1.3º C, +1.7º C
Official (Airport) Temperature Difference from normal:
+0.9º C, +1.3º C, +1.8º C
City Stations Precipitation difference normal:
-560.5mm (74.0% of normal)
Official (Airport) Precipitation difference from normal:
NA
Days of Precipitation for December 2015*
>= 0.2 mm: Normal: 20.5 : This Month: 29
>= 5 mm: Normal: 13.1 : This Month: 17
>= 10 mm: Normal: 10.0 : This Month: 12
>= 25 mm: Normal: 5.3 : This Month: 7
*Denotes incomplete official Airport station data so using data from Alberniweather.
Days of Precipitation for the Year of 2015*
>= 0.2 mm: Normal: 190.8 : This Year: 174
>= 5 mm: Normal: 94.9 : This Year: 79
>= 10 mm: Normal: 65.6 : This Year: 48
>= 25 mm: Normal: 27.6 : This Year: 17
*Denotes incomplete official Airport station data so using data from Alberniweather.
Comparison to recent Decembers and Years at Alberniweather (unless specified)
- 2014: See the December and Annual 2014 Summary Warmer during the nights in December 2014 (and no snow!) but more precipitation/rain in 2015.
- 2013: See the December and Annual 2013 (Extreme Dryness). December 2013 was extremely dry but cooler than 2015 .
- 2012: Much Warmer this year (2015) more rain.
- 2011: Much Warmer this year (2015) more rain.
- 2010: About the same warmth and rain (Another El Niño year)
- 2009: Much Warmer this year (2015) more rain.
- 2008: Much Warmer this year (2015) more rain.
- 2007: Much Warmer this year (2015) more rain.
- 2006: A little Warmer this year (2015) same rain.
