The Arctic continues to thin….
FYI: Weather updates are back. Webcam updates remain offline.
A quick update on what is happening in the Arctic.
The records for extent and area of ice surface have been smashed. The 2007 record of 4.1 million square kilometres of ice coverage was broken on August 26.(NSIDC) We are currently below around 3.5 million square kilometers. A difference of area larger than the province of Ontario.
The climate change/global warming misinformants are out in force. I will be blunt. They are either lying, or incredibly stupid. This massive change is unprecedented in recorded human history, around 4000 years, and is wholly caused by the increase of CO2 in the atmosphere from human activity. Fact is, Climate Scientists have said the Arctic would be the proverbial Canary… And boy has it lived up to that. It has actually melted faster than even the most pessimistic models used by the IPCC.
Now that we have that out of the way.
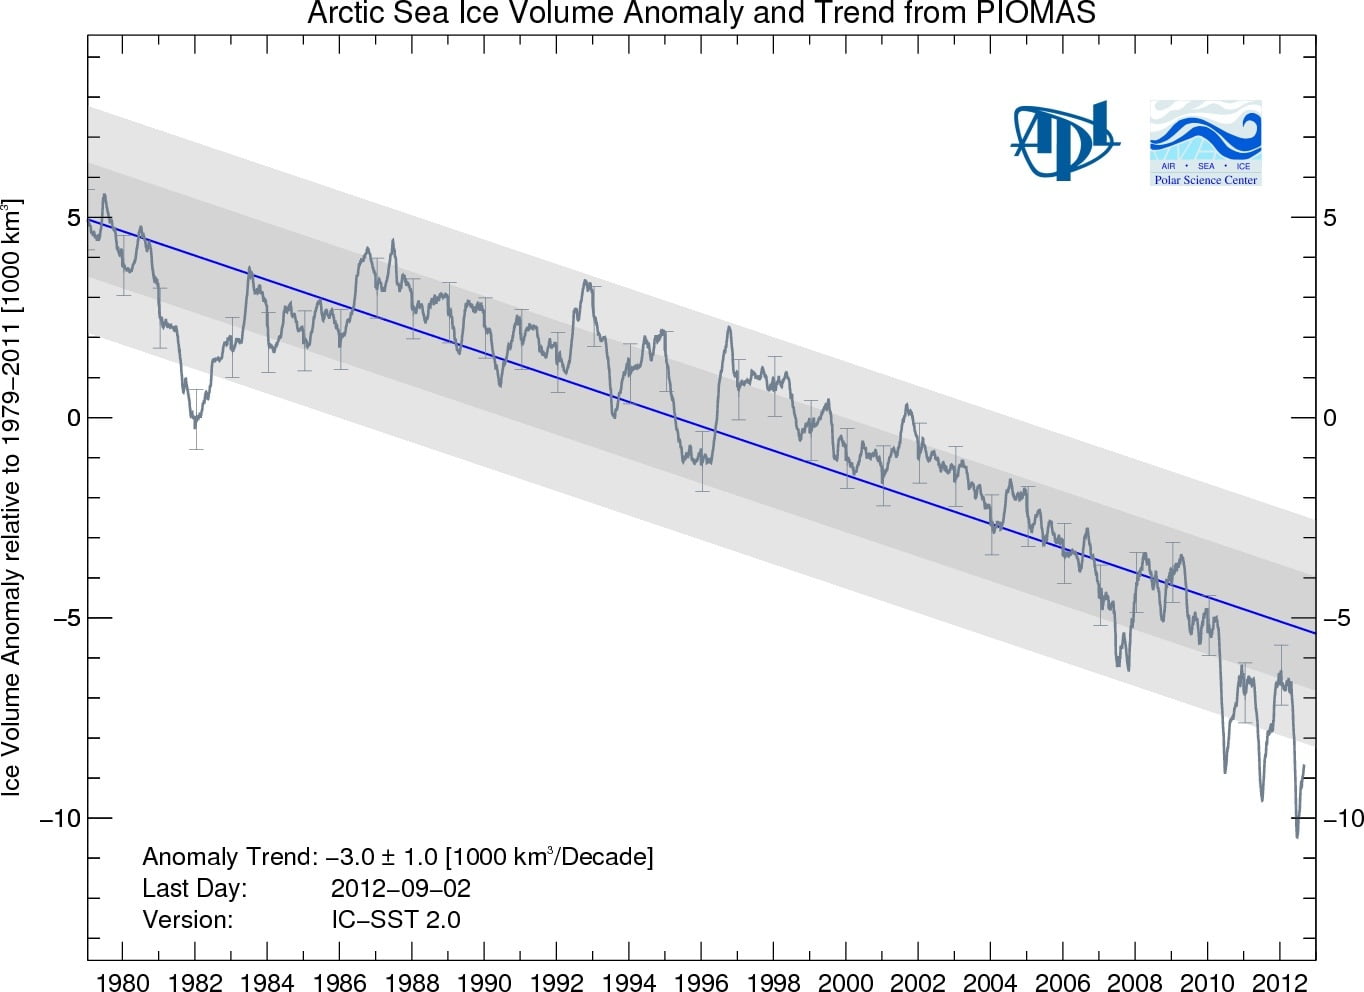
New satellites have allowed us to ‘see’ not only the surface area of the ice, but also it’s thickness. This data had only previously been available by squeezing the worlds Navy’s for their submarine data when they transitted through the ice. That data used by the PIOMAS Models at the University of Washington, has already shown that ice thickness has indeed been declining along with the extent since the 1980s.
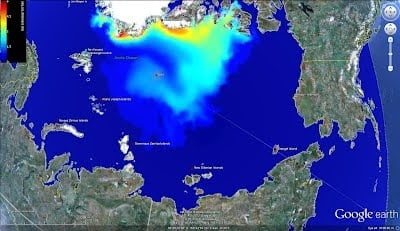
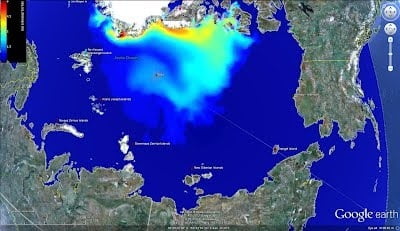
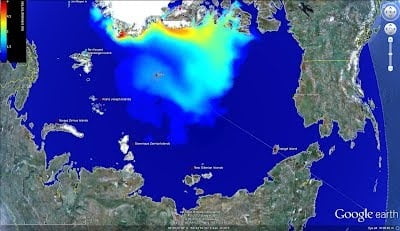
But now we have pretty pictures created from actual direct observations from satellites. Check out this series of images (updated daily plus Google KMLs here) They show ice thickness. Dark blue is water, Lighter Blue is less than 1-2m thick (considered ‘first year’ or generally ice at risk of melting next season)… Red is multi year ice 6 meters thick, black is 8 meters thick.
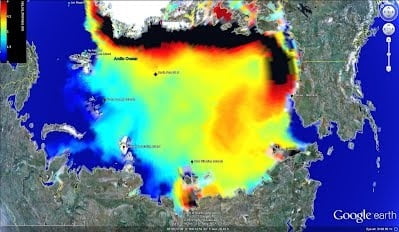 This is June 1 this year… Before the summer melt really kicked in:
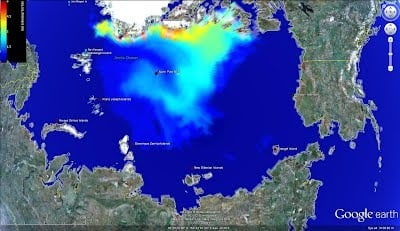
August, 25 (day before surface record broken)
#1: The first thing you should notice from the sequence is the disappearance of thick, multi year ice. Some of that will certainly return but this decline has been a big part of the changes that have happened over the past 30 years, and that have accelerated in the past 10.
#2: Notice the tongue of melt on the bottom portion of the ice that has grown since August and the larger curl of thin ice stretching around the north pole itself that persists. The north pole is nearly cutoff and on its own ‘island’ of slightly thicker ice.
The melt continues even now when the sun is setting and air temperatures are well below freezing (Alert, NU is -8C this morning). Why? Because water traps, and transports, heat from the sun very efficiently. So the effects of all that ice loss continues to have an impact long after air temperatures go below freezing. If you live at Sproat Lake you’ll notice this type of effect when you go for a swim at this time of year. The water is still relatively warm even though there is a chill in the air.
You can guarantee that scientists will be keeping on top of these incredible changes as much as they can, and will be studying how it will (because it will) change weather patterns down here in the mid-latitudes. A prominent theory of late ‘Warm Arctic Cold Continents‘.
Until next time….


Human beings, who are almost unique in having the ability to learn from the experience of others, are also remarkable for their apparent disinclination to do so.
—Douglas Adams
“There is more stupidity than hydrogen in the universe, and
stupidity has a longer shelflife.”
—Frank Zappa