March 2024 – Warmer like the Globe – Snowpack Extremes
The Drought begins again.
Apologies for the very late summary. April is a crazy month so I’m just happy I was finally able to get this done! Lots of information about March’s stats is below and lots of what happened in March will have an impact on the summer and the rest of the year!
“As of April 1st, the provincial snowpack is extremely low, averaging 63% of normal across BC. Last year the provincial average was 88%. It is the lowers snowpack on record since 1970. The Snow Basin Index for Vancouver rose slightly, from 46 to 49% of Normal.
Nearly all snow basins are at or below 80% of normal, with extremely low snowpack (<60%) persisting in the Upper Fraser East, Quesnel, Chilcotin, Central Coast, South Coast, Skagit, Vancouver Island, Skeena-Nass and Liard.“
Ironically, they state “monthly precipitation totals were normal for Vancouver Island”. As a whole this is true, but for the Port Alberni weather stations, we were actually only between 70-80% of normal precipitation in the Valley and City respectively.
If there is a glimmer of hope, it is that 2024 will not be the lowest ever for snowpack on Vancouver Island. That title is still held by the 2015 season, says the Centre: “Despite the extremely low 2024 April 1st SBI values in the southwest (27-53% of normal on Vancouver Island, South Coast and Skagit) these regions were considerably lower in 2015, their lowest year on record, when April 1st SBI values ranged from 13-26% of normal.”
Compared to 2023, Vancouver Island was 76% in 2023 versus 49% this year.
Latest Snow Commentary
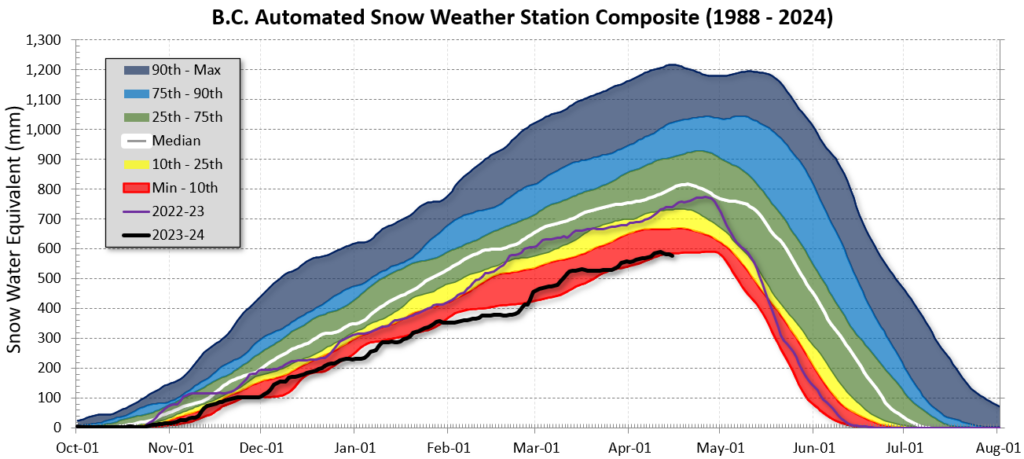
A good part of being so late for the summary is that I can include the Bi-Weekly Commentary which just came out yesterday, April 15. Unfortunately, as you can see by the thick black line below, the news hasn’t improved through the first weeks of April. We are at extreme minimums for snow water equivalents in the province.
The commentary mentions the phenomenon we have also seen on Vancouver Island of lower-elevation snow disappearing.
“At lower elevations, short periods of warm weather have melted the shallower than normal snowpack resulting in much earlier melt than normal… The shift to much earlier than normal snowmelt is visualized at the Brenda Mine (2F18P) station, a lower elevation station within the Okanagan basin between Merritt and West Kelowna. It will likely reach snow free conditions later this week, several weeks earlier than normal.”
Finally, as for the actual snowpack numbers on the Island, here they are:
Location: March 1 : April 1: April 15
Wolf River (North Island): 62% : 71% : 72%
Jump Creek (South Island): 0% : 37% : 37%
Heather Mountain (South Island high-elv): 37% : 58% : 57%
Mount Arrowsmith (East Side – Webcam): 52% : 74% : 68%
OVERALL VAN ISLE: March 1 50% : April 1 60% : April 15 59%
How did Port Alberni Do?
Exactly 0.9ºC above normal
It’s not often that all of the differences-from-normal match. In March they did at the Airport compared to the long term “Normals” at Roberson Creek. The average minimum, maximum and mean temperatures at the Airport were all 0.9ºC above the normal for March.
We didn’t set a lot of official daily records at the Airport this month and none were all time or station, but there were four new daily high temperatures and one rainfall. We are just generally warmer than normal, in line with global warming as a whole, but thankfully not to the absolute extreme.
El Niño did what it does
The April Snow Bulletin had some comments on El Niño as well.
“BC’s weather and snowpack in winter 2023-2024 have followed patterns that would typically be expected for an El Niño event.” They expect “an earlier and more accelerated spring melt” based on this and seasonal forecasts from Environment Canada.
The ENSO Alert Status has an El Niño Advisory and La Niña Watch meaning we are still in a weakening El Niño with “a transition from El Niño to ENSO-neutral” likely (85% change) by April-June. Meanwhile “the odds of La Niña developing by June-August” are at 60% which is a little higher than previous forecasts.
They say “La Niña tends to follow strong El Niño events, which also provides added confidence”.
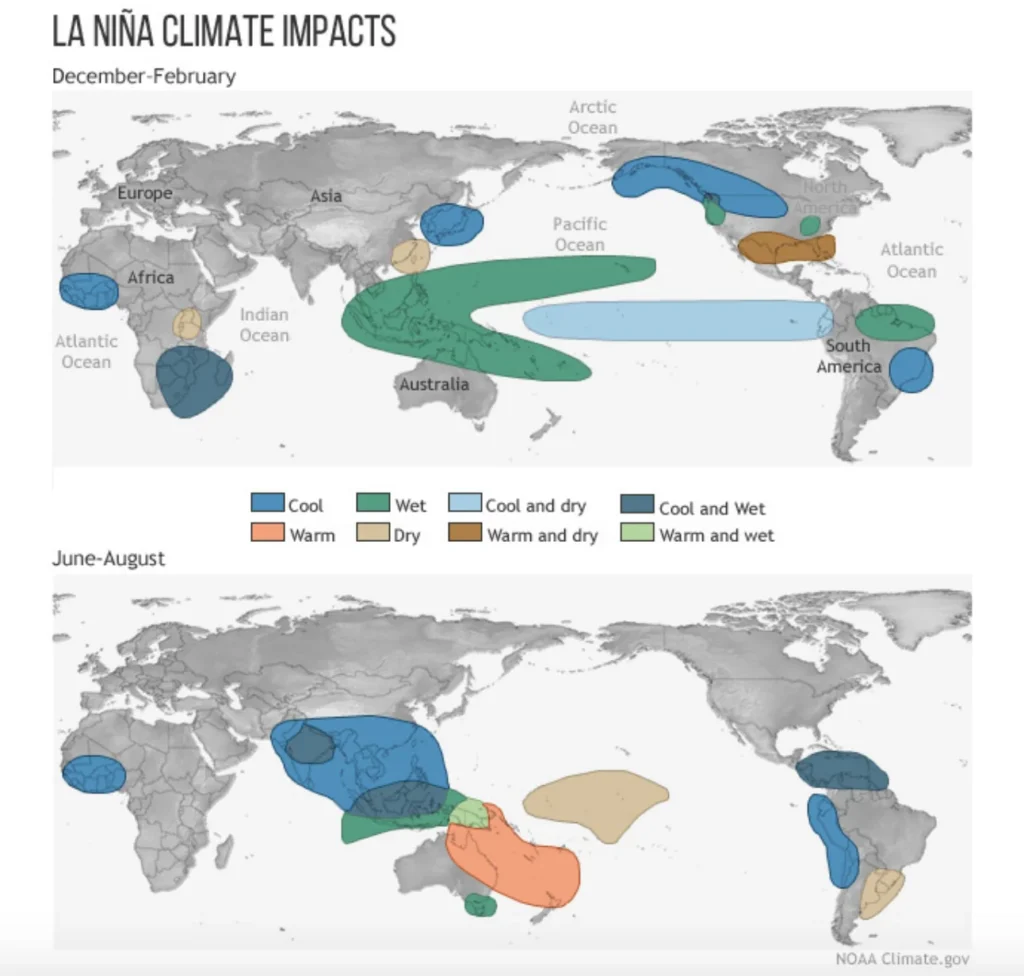
What does a La Niña do to BC weather? Usually it makes things colder and wetter. This Weather Network post has an excellent in depth explanation of various factors. It also has this nice image of the ways La Niña impacts climate and weather patterns around the world.
This Month’s Timelapse
This month’s timelapse complete with the big switch from cold to warm!
Next month we should have three views to see on the timelapse! Exciting times!
That’s all for March 2024! Thanks for stopping by!
Airport Daily Records Set this Month
Set at Airport* since 1994 and compared to Valley stations** for all time. (since 1895 for rain, 1900 for temperatures,1980 for snow on ground)
Only a few extremes set at the Airport this month. None approached an all time record. There was 1 rainfall and 4 high temperature records set. Of note: the all time Rainfall record for March 9 was set at China Creek, which is unusual. It got 0.3 mm more rain on that day in 1974 than the Beaver Creek station.
* May have used backup Environment Canada Data source at WeatherStats.ca for Missing Data
** Short Term means since 1994 at the new AVRA Airport. Airport Records are compared to the 30+ year weather stations of record since 1900 (1895 for rain) at Beaver Creek, Port Alberni “City” and Robertson Creek. Note that records pre 1950 may be more likely to over-estimate high temperatures.


Comments
One response to “March 2024 – Warmer like the Globe – Snowpack Extremes”