There was a lot of worry early in January as we went through a prolonged cold spell. Rightly so, it was cold. But humans have short memories. Any of the old timers in Port Alberni might have chuckled a little because they might remember Port Alberni in 1950 (see the data) when temperatures reached -25.6ºC.
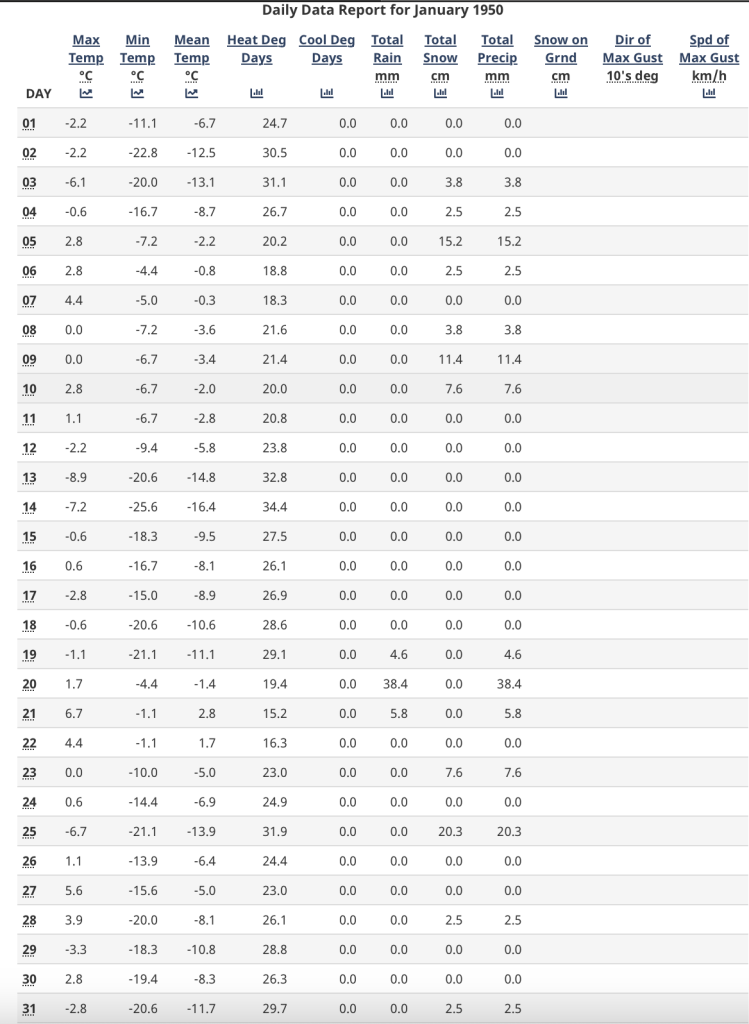
In fact, the entire month of January 1950 saw three periods of temperatures below -20.0ºC. Check out the data from Beaver Creek below.
A picture of the weather data captured at the Beaver Creek station in January 1950.
These temperatures are mostly long forgotten and certainly diminished in the din of daily breaking news. While not impossible, I believe it is safe to say cold temperatures like these are becoming less and less likely in our region as the world warms. As a more recent example, people might remember the cold snaps in January 1993 when we reached -15ºC at Robertson Creek or 1982 when we reached -14.7ºC at Somass. These were still colder than our -13.6ºC mark this month.
But it was still Extreme –> Switch to Heat
That said, what really was extreme was the huge swing. If we look at that 1950 example, the difference between the lowest low, -25.6ºC, and the highest high, +6.7ºC, was 32.3º.
This January 2024 the lowest low (at the Airport) was -13.6ºC and the highest high was +12.8ºC, a difference of 26.4º.
So 1950 was truly the most extreme for cold and the switch.
However, I think it is worth recognizing that our high temperature in January 2024 was double the 1950 mark and that has had a very large impact on our snowpack.
We tied one all time high temperature record and came within 4º of breaking 3 more all time high records.
It is clear which direction we are trending.
What about that Snowpack?
Bulletin to be issued February 8
The River Forecast Centre will issue their monthly update on February 8. I don’t expect good news for Vancouver Island.
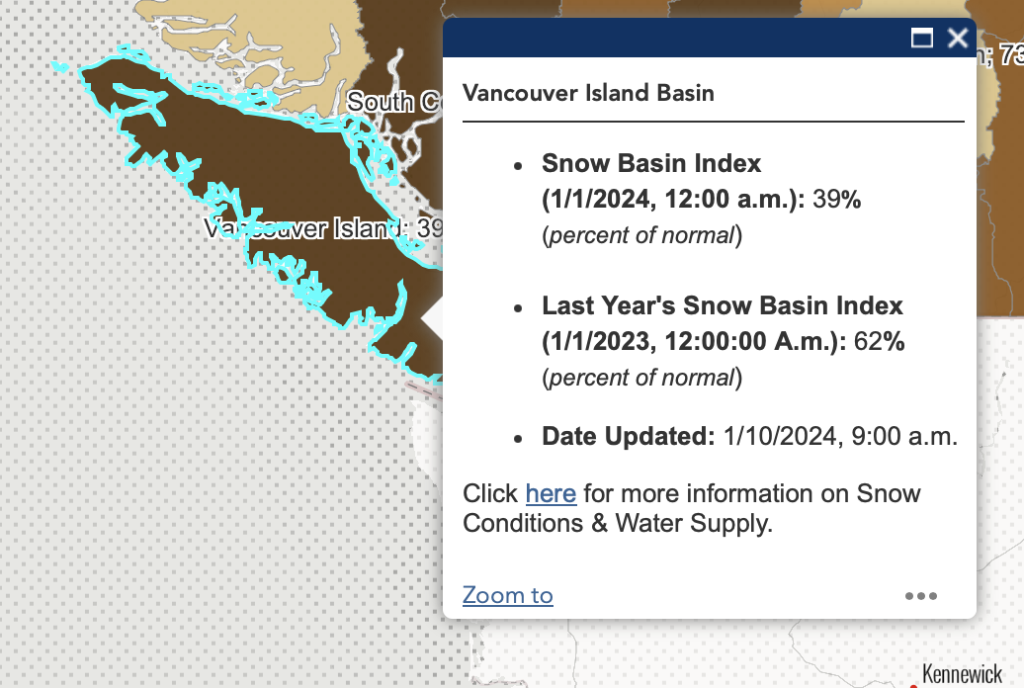
At the start of January, before the cold snap and snow, we were at about 40% normal levels for snow on the North and South Island.
“Beginning on January 26th, a series of storms impacted the province, primarily impacting Vancouver Island and the South Coast. Many of the storms were classified as atmospheric rivers sourced from tropical regions. The result was very heavy rainfall through much of the coast with temperatures at or near record high temperatures during the period of January 26 to February 1st.”
The raw data from the weekly summaries is not encouraging.
On Vancouver Island here are the Atmospheric River “before” (Jan 22) and “after” (Feb 1) percentages for the four Vancouver Island snow stations:
Wolf River (North Island): 60% : 54%
Jump Creek (South Island): 27% : 0%
Heather Mountain (South Island high-elv): 42% : 28%
We’ll have to wait for their new bulletin this week but I don’t expect good news.
El Niño and Atmospheric Rivers like 2010 Olympics.
You might remember 2010 during the Olympics when they had to bring in all of the snow to the North Shore mountains to make sure there was enough for the events to happen. That was El Niño (and global warming) and this year is no different.
Well… until this year. And that’s all for this month’s summary. Check out a little more detail in the Airport Records below and you can also see the Timelapse and podcast if you haven’t already.
Forecast tomorrow!
This Month’s Timelapse
This month’s timelapse complete with the big switch from cold to warm!
Set at Airport* since 1994 and compared to Valley stations** for all time. (since 1895 for rain, 1900 for temperatures,1980 for snow on ground)
Two extremes bookended the month. Five new Low Temperature records were set at the Airport. None were close to an All Time. The closest was January 12 which was 2.9ºC away from the coldest all time. The furthest was Jan 14 which was 13.9ºC warmer than the coldest all time of -25.6ºC.
Four new High Temperature records were set. January 31 tied the all time record for that date of 12.8ºC. All others were within 3.5ºC of records.
January 29 set both a rainfall record of 76.9mm (all time was 112) and a high temperature record (0.5ºC from an All Time).
There were many Snow on Ground measurements which registered as a record but this is a new type they are recording. Most were first-time measurements. This is not easily comparable to historical records.
* May have used backup Environment Canada Data source at WeatherStats.ca for Missing Data
** Short Term means since 1994 at the new AVRA Airport. Airport Records are compared to the 30+ year weather stations of record since 1900 (1895 for rain) at Beaver Creek, Port Alberni “City” and Robertson Creek. Note that records pre 1950 may be more likely to over-estimate high temperatures.