
May 2017. Back to the grind.
Happy Summer Solstice on this June 20th, the longest day of the year! 🙂
Here is the long awaited summary for May. Because the spring was kinda lousy a lot of us likely thought that May was just as bad for being abnormally dreary. But cheer up! Actually, it was not too bad a month.
Click through for more under the fold!
For May, the averages were very close to normal with less than a degree difference for low, median and high temperatures recorded at the Airport compared to the historical normals.
We managed to set two new high temperature records at the Airport, including one 30.3ºC on the 22nd that came just 0.4ºC away from breaking an all time record for the day. We also set a low temperature record on the 24th, but it was nowhere near the below-freezing mark for the all time.
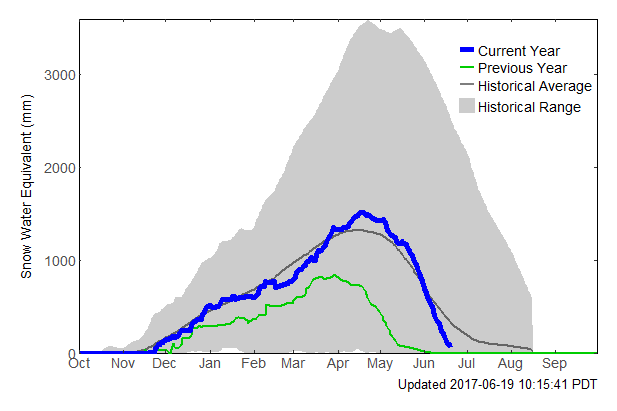
You’ll want to check out the snowpack conditions as well as the seasonal predictions. We have a very rapidly depleting snowpack on the South Island that is almost gone and the North Island is not too far behind but is in better shape than last year.
On a wider scale, the last half of June is going to be split between nice and sunny and warm this week, and cloudy and dreary next week. This, again, isn’t totally abnormal for June and early July on the West Coast but lets hope the forecast improves for the July 1 festivities!
Finally, the models seem to be making some waves when it comes to Hurricane season in the USA and Mexico. Might be a big one… and make sure you check out the Sea Surface anomaly at the very bottom. A big surprise!
Most Notable Event of May 2017
You have to give it to the near-all time record set on the 22nd! It was sure nice to feel that heat after so many months of constant rain!
Enjoy the rest of the post!
Monthly Timelapse Video
You can check out the videos at:
https://www.youtube.com/user/alberniweather/videos
Daily records set this month at the Airport* since 1995 and compared to other stations** for “All Time” since 1900.
Two new short term high temp records and one low temp record. No All Time records (though close!) and no short term rain records.
- May 22 high temp 30.3º C: #1 is 30.6º C in 1969 at Robertson Creek.
- May 24 low temp 2.5º C: #1 is tied at -2.2º C in 1950 at Beaver Creek and 1975 at Robertson Creek.
- May 29 high temp 29.3º C: #1 is 34.5º C in 1983 at Robertson Creek.
*May have used backup Env Canada Data source at WeatherStats.ca
**Short Term means since 1995 at the new AVRA Airport.
Airport Records are compared to the 30+ year weather stations of record since 1900 (1895 for rain) at Beaver Creek, Port Alberni “City” and Robertson Creek. Note that records pre 1950 may be more likely to over-estimate high temperatures.
May 2017 Minimum, Mean, and High Average Temp, Total Precipitation and Highest Wind
SEE Last Month’s AND LAST MAY’S SUMMARY.
Alberniweather: 8.0º C, 13.6º C, 19.6º C, 40.4 mm
High Wind: SE 56.3 kph on the 23rd
Alberni Elem. School : 7.7º C, 13.5º C, 19.6° C, 49.5 mm
High Wind: SSE 35kph on the 23rd
Maquinna Elem. School: NA, NA, NA, 52.7 mm
High Wind: NNE 30kph on the 23rd
Nick’s Station (Maquinna area): 7.7º C, 13.3º C, 18.9º C, 41.4 mm
High Wind: SSE 46.3kph on the 5th
Neptune Canada Station: NA, NA, NA, NA
High Wind: NA
Overall City Average: 7.8º C, 13.5º C, 19.4º C, 46.0 mm
Environment Canada Airport* : 5.7º C, 12.6º C, 19.4° C, 43.9 mm
High Wind: SW 41kph on the 23rd
Normal 1981-2010 (Rbrstn Creek): 6.0º C 12.3º C 18.6° C 87.8 mm
*May have used backup Env Canada Data source at WeatherStats.ca
Differences from Normal at Robertson Creek
City
+1.8° C, +1.2º C, +0.8º C, -41.8 mm (52.4% of normal)
Official Airport
-0.3° C, +0.3º C, +0.8º C, -41.8 mm (50.0% of normal)
Days of Precipitation for May 2017*
Amount : Normal Days : Days This Month
>= 0.2 mm: 15 : 16
>= 5 mm: 5.2 : 2
>= 10 mm: 2.9 : 0
>= 25 mm: 0.54 : 0
*May have used backup Env Canada Data source at WeatherStats.ca
Comparison to recent months of May at Alberniweather
MOST SIMILAR ALBERNIWEATHER MAY TO THIS MONTH? May 2008
May 2008 had an identical average minimum temperature of 8.0ºC. 2008 had a slightly higher high temperature and it rained about 10mm more but overall it was the most similar in the Alberniweather record set.
- 2016: Warmer 2016 and less rain. See the May 2016 Summary
- 2015: Much warmer 2015 and very dry. See the May 2015 Summary
- 2014: Warmer and rainier 2014. Less rain. See the May 2014 Summary
- 2013: Similar temperatures 2013 but much rainier.
- 2012: Cooler 2012 and more rain.
- 2011: Very cool 2011 and extremely rainy.
- 2010: Very cool 2010 and extremely rainy.
- 2009: Much cooler 2009 and very rainy.
- 2008: Similar cool and rain.
- 2007: Similar 2007 but much rainier.
- 2006: Slightly cooler and rainier 2006.
River and Drought Conditions
The BC River Forecast Centre reports that rivers are running strong on the majority of Vancouver Island. The data has not updated since October.
The Real Time river flow data shows the recent rainfall boosting up the level last week and is now gradually diminishing. Nothing out of the ordinary.

The overall Drought Level picture is now up and all regions of the province are looking good.

Snowpack Situation
The snowpack on the South Island has dropped very quickly and is now nearly depleted. We can expect to see water restrictions ramp up in Nanaimo, Parksville, and Cowichan areas as a result as soon as the weather turns.
South Island/Jump Creek (near Nanaimo Lakes) elevation 1134m

The North Island snowpack is not dropping quite as fast. You can also see in the graph below how much later the snowpack peaked this year compared to last year thanks to our cool spring. The freshet will continue into the Stamp, Sproat and Somass systems for a few weeks yet which should be good for the very low number of returning Sockeye.
North Island/Wolf Creek (near Gold River) elevation 1422m.

SpotWX 16 day Outlook — A little Warmer but cloudy!
The long term outlook has good and bad news. The good news is this next week we are definitely in a warming trend! The bad news is after the weekend, we definitely hit another cool and cloudy trend and worse, the Canada Day long weekend is looking to get the worst of it. Lets hope that that forecast is wrong!


El Niño/La Niña Discussion:
NO Alerts Active.
The current discussion indicates that there is only a slight chance of a weak El Niño forming this summer. The prevailing observations, and prediction models, favour a Neutral condition into the fall.
Three-Month N-America Forecasts
The Temperature anomaly for the next 3 months.
The July, August, September prediction spreads a little warmer than normal conditions more evenly across the continent. It is refreshing not to see the high Arctic in bright red for once…

Last Month’s Three Month Forecast.

We’ll see what the fall holds below.
Precipitation Forecast.
Precipitation patterns have not changed too much with a slight shift to wetter than normal over the Central and North Coast of BC and a pull back of wetness in the prairies.
It is worth nothing the dark areas of greater than normal precipitation along the Pacific and Gulf Coasts of Mexico. This might indicate a strong Hurricane season. This was also hinted at last month.

Last Month’s Three Month Forecast.

Global seasonal forecasts
Global Temp and Precip Spring, Summer, Fall and/or Winter forecast from current and last month runs. Only 1 of 2 seasons are within the forecasts in any given month.
This months seasonal forecasts: Fall 2017
Temperatures.
Fall – Once again, the forecast has backed off on predicted heat. This is the 3rd month in a row that the models have lessed global heat anomalies. We can also see the warmth along the equator subsiding in the prediction, which is likely why El Niño predictions have backed off as well. In all, the greatest abnormal heat remains in the Arctic regions but other than that, most populated areas are only in the 0.5-1ºC above normal range, which compared to recent years, is going to feel cool.
This Month’s Fall Global Outlook

Last Month’s Global Fall Outlook

Precipitation Forecasts
Fall:
The precipitation has backed off in the equatorial Pacific (again an indicator of Neutral conditions) but there is a little more abnormally high precipitation in the Hurricane zone of the Caribbean and Gulf of Mexico, so we will want to keep an eye on that.
This Month’s Global Fall Outlook

Last Month’s Global Fall Outlook

Sea Surface Temperature next 3 months
Look at all that blue in the Arctic! I could cry for joy….
This Month’s 3-month outlook on SSTs

Last Month’s 3-month outlook on SSTs

That’s it