Warm wind for the next 5 days – Important Climate study update
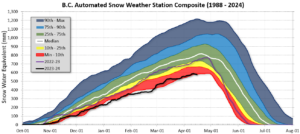
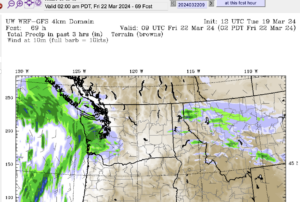
The rain will continue, as will the warm winds until at least Tuesday and possibly Thursday. Mt. Washington is open starting today with a 100cm base.. If you can’t wait to get up the mountain this weekend make sure you are prepared for whiteout conditions. The snow will be fresh, and flying!
In other news:
A major study was published in Environmental Review Letters checking whether current observations from multiple sources of world temperatures and sea levels match IPCC predictions for global warming and climate change. They also did something fairly unique I believe in that they adjusted temperatures to remove the variability from volcanic eruptions, variations in solar activity and most importantly, variations in El Niño/La Nina patterns which greatly affect year-to-year temperatures. Strip those away and you finally get to see the underlying trend.
The answer, yes weve been right for temperatures, but No for sea levels, where we have underestimated.
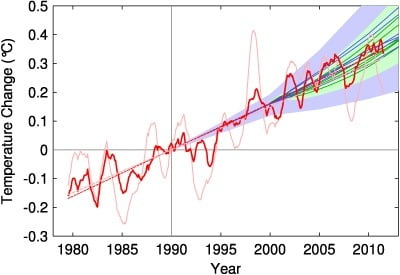
Here are temperatures, pink and red unadjusted and adjusted temperatures are nicely in the middle over the last 30 years.
Figure 1. Observed annual global temperature, unadjusted (pink) and adjusted for short-term variations due to solar variability, volcanoes and ENSO (red) as in Foster and Rahmstorf (2011). 12-months running averages are shown as well as linear trend lines, and compared to the scenarios of the IPCC (blue range and lines from the third assessment, green from the fourth assessment report). Projections are aligned in the graph so that they start (in 1990 and 2000, respectively) on the linear trend line of the (adjusted) observational data.
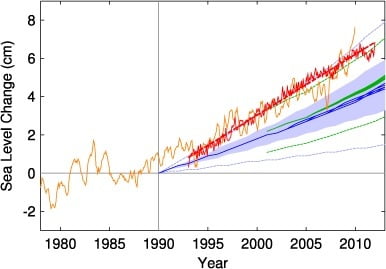
Here are sea levels, the red and yellow observations (satellites and tide gauges respectively) are quite a bit higher than the IPCC forecasts.
Figure 2. Sea level measured by satellite altimeter (red with linear trend line; AVISO data from (Centre National d’Etudes Spatiales) and reconstructed from tide gauges (orange, monthly data from Church and White (2011)). Tide gauge data were aligned to give the same mean during 1993–2010 as the altimeter data. The scenarios of the IPCC are again shown in blue (third assessment) and green (fourth assessment); the former have been published starting in the year 1990 and the latter from 2000.
The upshot is that this study will be included in the next IPCC update due out next fall and we can expect it to have a major impact on how fast they predict sea levels to rise as Greenland and the Antarctic peninsula melts, the sea warms and expands, and the East Antarctic ice shelf fails to gather as much snow as once thought.